President-elect Donald J. Trump: geography of the Electoral College
In the second-of-five in the fifth installment of a five-part series analyzing each Presidential candidate’s policies, Samantha Lindsay dissects the geography of the Electoral College.

https://www.flickr.com/photos/donkeyhotey/24101702220/in/photolist-CHMwo1-JJBqbo-JfqXJj-HtipDo-EmeBfD-q2LvvN-4EjNgb-hmzdu9-pFhzks-q4cpTN-rfqjvv-qb6LLi-q4cTcY-hFgVz7-hFhnAV-HPBQTn-fw4bh2-qXV8Bc-H9ycLj-j4Mzc2-qTskgB-DGFjYr-jc1Ah1-DdGiqr-E7VzQR-qFKZcy-pvL18H-aK7mXD-E7VA8z-CKwfkh-rMrUHE-rBeoWw-dhh6C5-rPZNZd-s7s6xE-dfrMXk-DuGv5d-DajVcb-fw4bfZ-GfbhE9-q3yPGu-oykALh-HV12FW-qb5h4H-CKwgN7-EfaRhe-jP8E6c-nWr2DW-DUbqVj-rQ8WnK
Written by Samantha Lindsay
The following report is the second-of-five in the fifth installment in a series presenting a comparative analysis of select legislative proposals that were a part of the platforms of the two major candidates in the 2016 presidential election; Democrat (D) Hillary Rodham Clinton and Republican (R), Donald J. Trump. In the four previous installments published before the election, I addressed the candidates’ positions on the issues of paid family leave, the economy, gun control, and the Affordable Care Act.
This series is not an endorsement of either candidate.
The Geography of the Electoral College
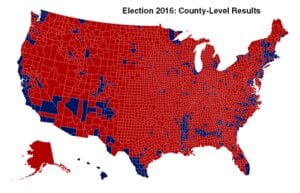
In the map below (created by Metrocosm), the red areas represent counties won by Trump, and the blue areas represent counties won by Clinton.
According to the U.S. Geological Survey, “There are 3,141 counties and county equivalents in the 50 States and the District of Columbia.” According to Politico’s most recent county by county election results, Trump won 2,627 counties (84 percent), and Clinton won 514 counties (16 percent).
Many of the blue counties won by Clinton are the locations of the most densely populated urban centers in the country including Los Angeles, Houston, Chicago and New York City among others. Clinton won these cities by large margins. The red parts of the map represent a more broadly dispersed population in small cities, towns, suburbs and rural communities. The greater geographical dispersal of Trump’s voters vs. Clinton’s voters is why Trump won a total of 30 states (while losing the popular vote), thereby winning the Electoral College.
Trump is the fifth president-elect in American history to win the Electoral College after losing the popular vote. The geographical dispersal of Trump’s voters and the results of this election have led some people to conclude that small states are over-represented by the Electoral College. While that is technically true, the results of this election do not demonstrate that small states have a significant advantage in the Electoral College, nor are they exclusively responsible for Trump’s victory.
According to the U.S Census Bureau, the population of the U.S. is 321,418,820. Since there are 538 electors, the national average per state is one Electoral College vote for every 597,433 citizens. The ratio of Electoral College votes per group of citizens in twenty states falls within a range of 100,000 citizens of the national average, +/- 50,000. Nine of these states voted for Clinton and 11 voted for Trump, giving him a two-state victory in this representative set.
Twenty-four of the less populated states and the District of Columbia, by comparison, have a ratio of representation per population giving them more Electoral College votes per group of citizens than the national average. In those 24 states, the average ratio is one Electoral College vote per 400,654 citizens. There are nine small states (and D.C. for a total of 10) that voted for Clinton in this election. There are 14 small states that voted for Trump, giving him a five-state victory in this representative set.
Conversely, there are five states which have fewer Electoral College votes per group of citizens compared to the national average. These include California, Florida, New York, North Carolina and Texas which have an average of one Electoral College vote per every 703,875 citizens. Two of these states (California and New York) voted for Clinton, and three (Florida, North Carolina and Texas) voted for Trump, giving him a four-state victory in this representative set.
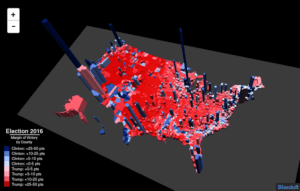
Clinton’s margin of victory in the popular vote was 1.6 percent, she only won 16 percent of the counties in the country and she did not win a majority of the states in any representative set. On the other hand, Trump won more states in each representative category in 84 percent of the nation’s counties. Therefore, I conclude that the small states did not have a significant Electoral College advantage in this election. However, if the United States were a direct democracy, the most populous states would have a significant advantage, and the populations of only 16 percent of U.S. counties would have decided the election.
Metrocosm created this three-dimensional representation of the total number of votes, illustrating this point:
Understanding the Electoral College and the dispersion of the American population does help explain how Trump won. An examination of the media will establish some of the context explaining why Trump’s victory was a surprise to many people. With further clarification, revisiting the electoral college will reveal who voted for Trump, which will help to explain why he won.
The next part of this installment will focus on the polls and the media.
Edited by Ben Webb
Featured image by DonkeyHotey on Flickr, obtained using creativecommons.org


